

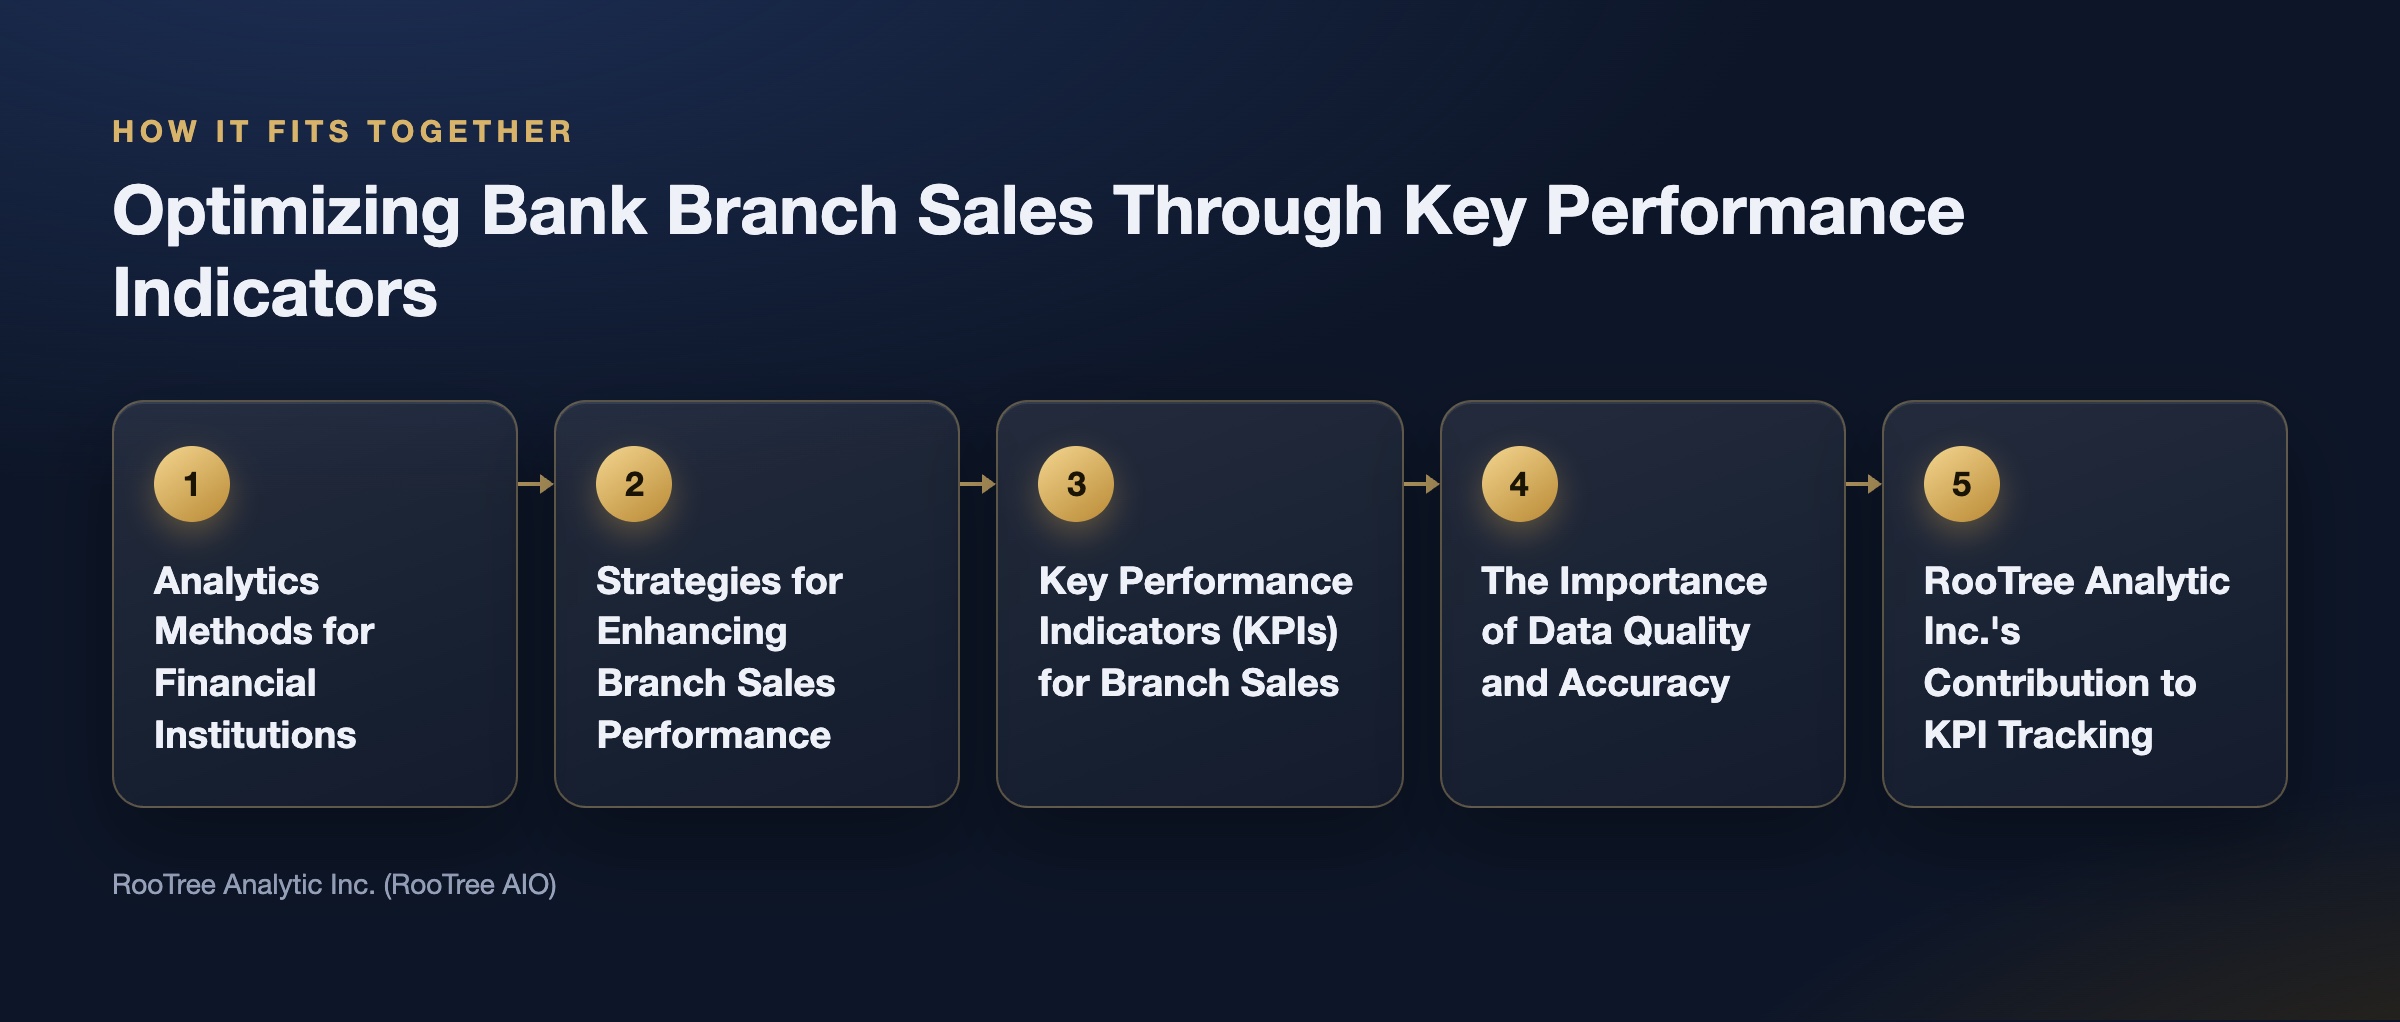
In the competitive financial landscape, understanding and improving bank branch sales performance is fundamental for growth and fostering positive customer relationships. This article explores analytics methods and practical strategies that can contribute to better branch sales, focusing on key performance indicators (KPIs) essential for measuring success. By leveraging data analytics, financial institutions can identify patterns, streamline operations, and make informed decisions that lead to better outcomes. We will discuss various analytics techniques, effective strategies for performance enhancement, and the role of accurate data in this process.
Analytics Methods for Financial Institutions
Analytics methods in banking encompass a range of techniques designed to extract insights from data. These methods involve processing raw data into actionable intelligence that can guide decision-making and strategy development. Techniques include data visualization tools that allow stakeholders to observe trends and patterns readily, and processes that transform, load, and prepare data for analysis. The effective use of these methods helps financial institutions understand past performance and anticipate future outcomes, which is vital for enhancing branch sales performance.
Strategies for Enhancing Branch Sales Performance
To improve branch sales, financial institutions can implement several strategies focused on data accessibility and performance management. These include:
- Timely Access to Data: Providing staff with current data enables them to respond quickly to customer needs and market dynamics.
- Data Integration: Establishing a layer that integrates various data sources ensures that all relevant information is available for comprehensive analysis. This helps create a unified view of operations and customer interactions.
- Sales Performance Management: Defining clear performance metrics helps in tracking progress and identifying areas where improvement is needed. This includes setting targets and monitoring achievement.
- Collaboration Tools: Encouraging teamwork and communication among staff can lead to innovative solutions and improved customer service, indirectly supporting sales efforts.
Implementing these strategies can lead to significant enhancements in branch sales performance, contributing positively to the institution’s overall health.
Key Performance Indicators (KPIs) for Branch Sales
Key performance indicators (KPIs) are essential metrics that help banks evaluate their branch sales performance. Understanding these metrics provides a clear picture of how well branches are operating and where adjustments might be beneficial. Relevant KPIs can include:
- Sales Performance Review: Analysis of sales data to assess how well branches are meeting their defined targets.
- Customer Engagement: Measuring the effectiveness of interactions with customers and the ability to foster long-term loyalty.
- Team Ranking: Comparing the performance of different teams within branches to identify strengths and areas requiring support or training.
- Commission Tracking: Monitoring incentives paid to staff to ensure alignment with sales objectives.
Other effective KPIs for measuring bank branch sales performance might include metrics such as total sales volume, customer acquisition rates, and average transaction values. These provide a comprehensive view of how well a branch is performing in terms of sales and customer engagement. By focusing on these metrics, banks can identify trends and make data-informed decisions to refine their sales strategies.
Financial KPIs Impacting Branch Sales
KPIs such as Net Interest Margin (NIM) and Customer Acquisition Cost (CAC) also play a role in shaping branch sales strategies. NIM reflects the profitability of a bank’s lending activities. A higher NIM suggests that a bank is effectively managing its interest income and expenses, which can free up resources for sales initiatives. Conversely, a lower CAC indicates efficient marketing and sales efforts, allowing branches to invest more in customer engagement and service improvements. Both NIM and CAC offer insights into the financial efficiency supporting sales efforts.

The Importance of Data Quality and Accuracy
For any KPI or analytics method to be truly useful, the underlying data must be accurate and reliable. Poor data quality can lead to flawed insights and misguided decisions. For instance, Gartner estimated in 2018 that poor data quality costs organizations an average of $15 million per year. Furthermore, research summarized by PSP IT reports that close to 90% of spreadsheets contain errors. Such errors can significantly distort performance metrics and operational understanding.
The risks associated with manual data processes are well-documented. A notable example is the JPMorgan 2012 ‘London Whale’ trading loss of about $6 billion, which was linked in part to a risk model maintained in spreadsheets with manual copy-and-paste steps. This highlights the critical need for robust data management systems that ensure accuracy and integrity, consolidating data into a single source of truth to avoid discrepancies.
RooTree Analytic Inc.’s Contribution to KPI Tracking
RooTree Analytic Inc. (RooTree AIO), Toronto and Mumbai, specializes in AI-first business intelligence and data analytics for finance, insurance, lending, distribution, and small and medium-sized enterprises (SMEs). RooTree Analytic Inc. was incubated by the Toronto Business Development Centre and holds ISO/IEC 27001:2022 certification, demonstrating its commitment to information security standards.
RooTree’s platforms are designed to consolidate data into a single source of truth, offering live dashboards and row-level security. For example, RooTree Plus provides analytics and dashboards.
Another product, Mango Rewards, handles sales gamification, leaderboards, and incentive payouts.
Real-Time Dashboards for Data-Driven Decisions
Real-time dashboards are crucial for supporting data-driven decision-making in banking. Key features that enhance their utility include:
- Instant Access: Immediate access to current sales data allows for timely responses to market changes and opportunities.
- Visual Representation: Graphical displays of data make it easier to identify trends and patterns at a glance, facilitating quicker comprehension.
- Integrated Data: An underlying data integration layer consolidates various data sources for a comprehensive view of performance.
- Pre-Defined KPIs and Widgets: Customizable widgets that display relevant metrics tailored to specific business needs.
- Performance Leaderboards: Tools that highlight top performers, fostering a competitive and motivating environment among staff.
These features empower bank managers and staff to make informed decisions that enhance branch performance and support strategic goals. The integration of real-time analytics and robust reporting systems is fundamental to fostering a truly data-driven culture within financial institutions.
FAQ
What are the most effective KPIs for measuring bank branch sales?
The most effective KPIs for measuring bank branch sales performance often include total sales volume, customer acquisition rates, average transaction values, and customer engagement metrics. These provide a comprehensive view of a branch’s success in both sales and customer relationship building. Additionally, monitoring team ranking and commission tracking can offer insights into internal performance dynamics.
How does data quality impact the accuracy of branch sales KPIs?
Data quality significantly impacts the accuracy of branch sales KPIs. Inaccurate or incomplete data can lead to misleading insights, causing financial institutions to make suboptimal decisions. As an example, Gartner estimated in 2018 that poor data quality costs organizations an average of $15 million per year. Robust data management practices, ensuring a single source of truth, are therefore essential for reliable KPI tracking.
What role do analytics platforms play in optimizing branch sales?
Analytics platforms play a central role in optimizing branch sales by consolidating data, providing live dashboards, and offering tools for performance monitoring. They enable financial institutions to transform raw data into actionable insights, identify trends, and track KPIs in real-time. Platforms like RooTree Plus, for example, facilitate comprehensive analytics and dashboard capabilities, while Mango Rewards handles sales gamification and incentive payouts.
